Add your data.
Let COTID™ run the math.
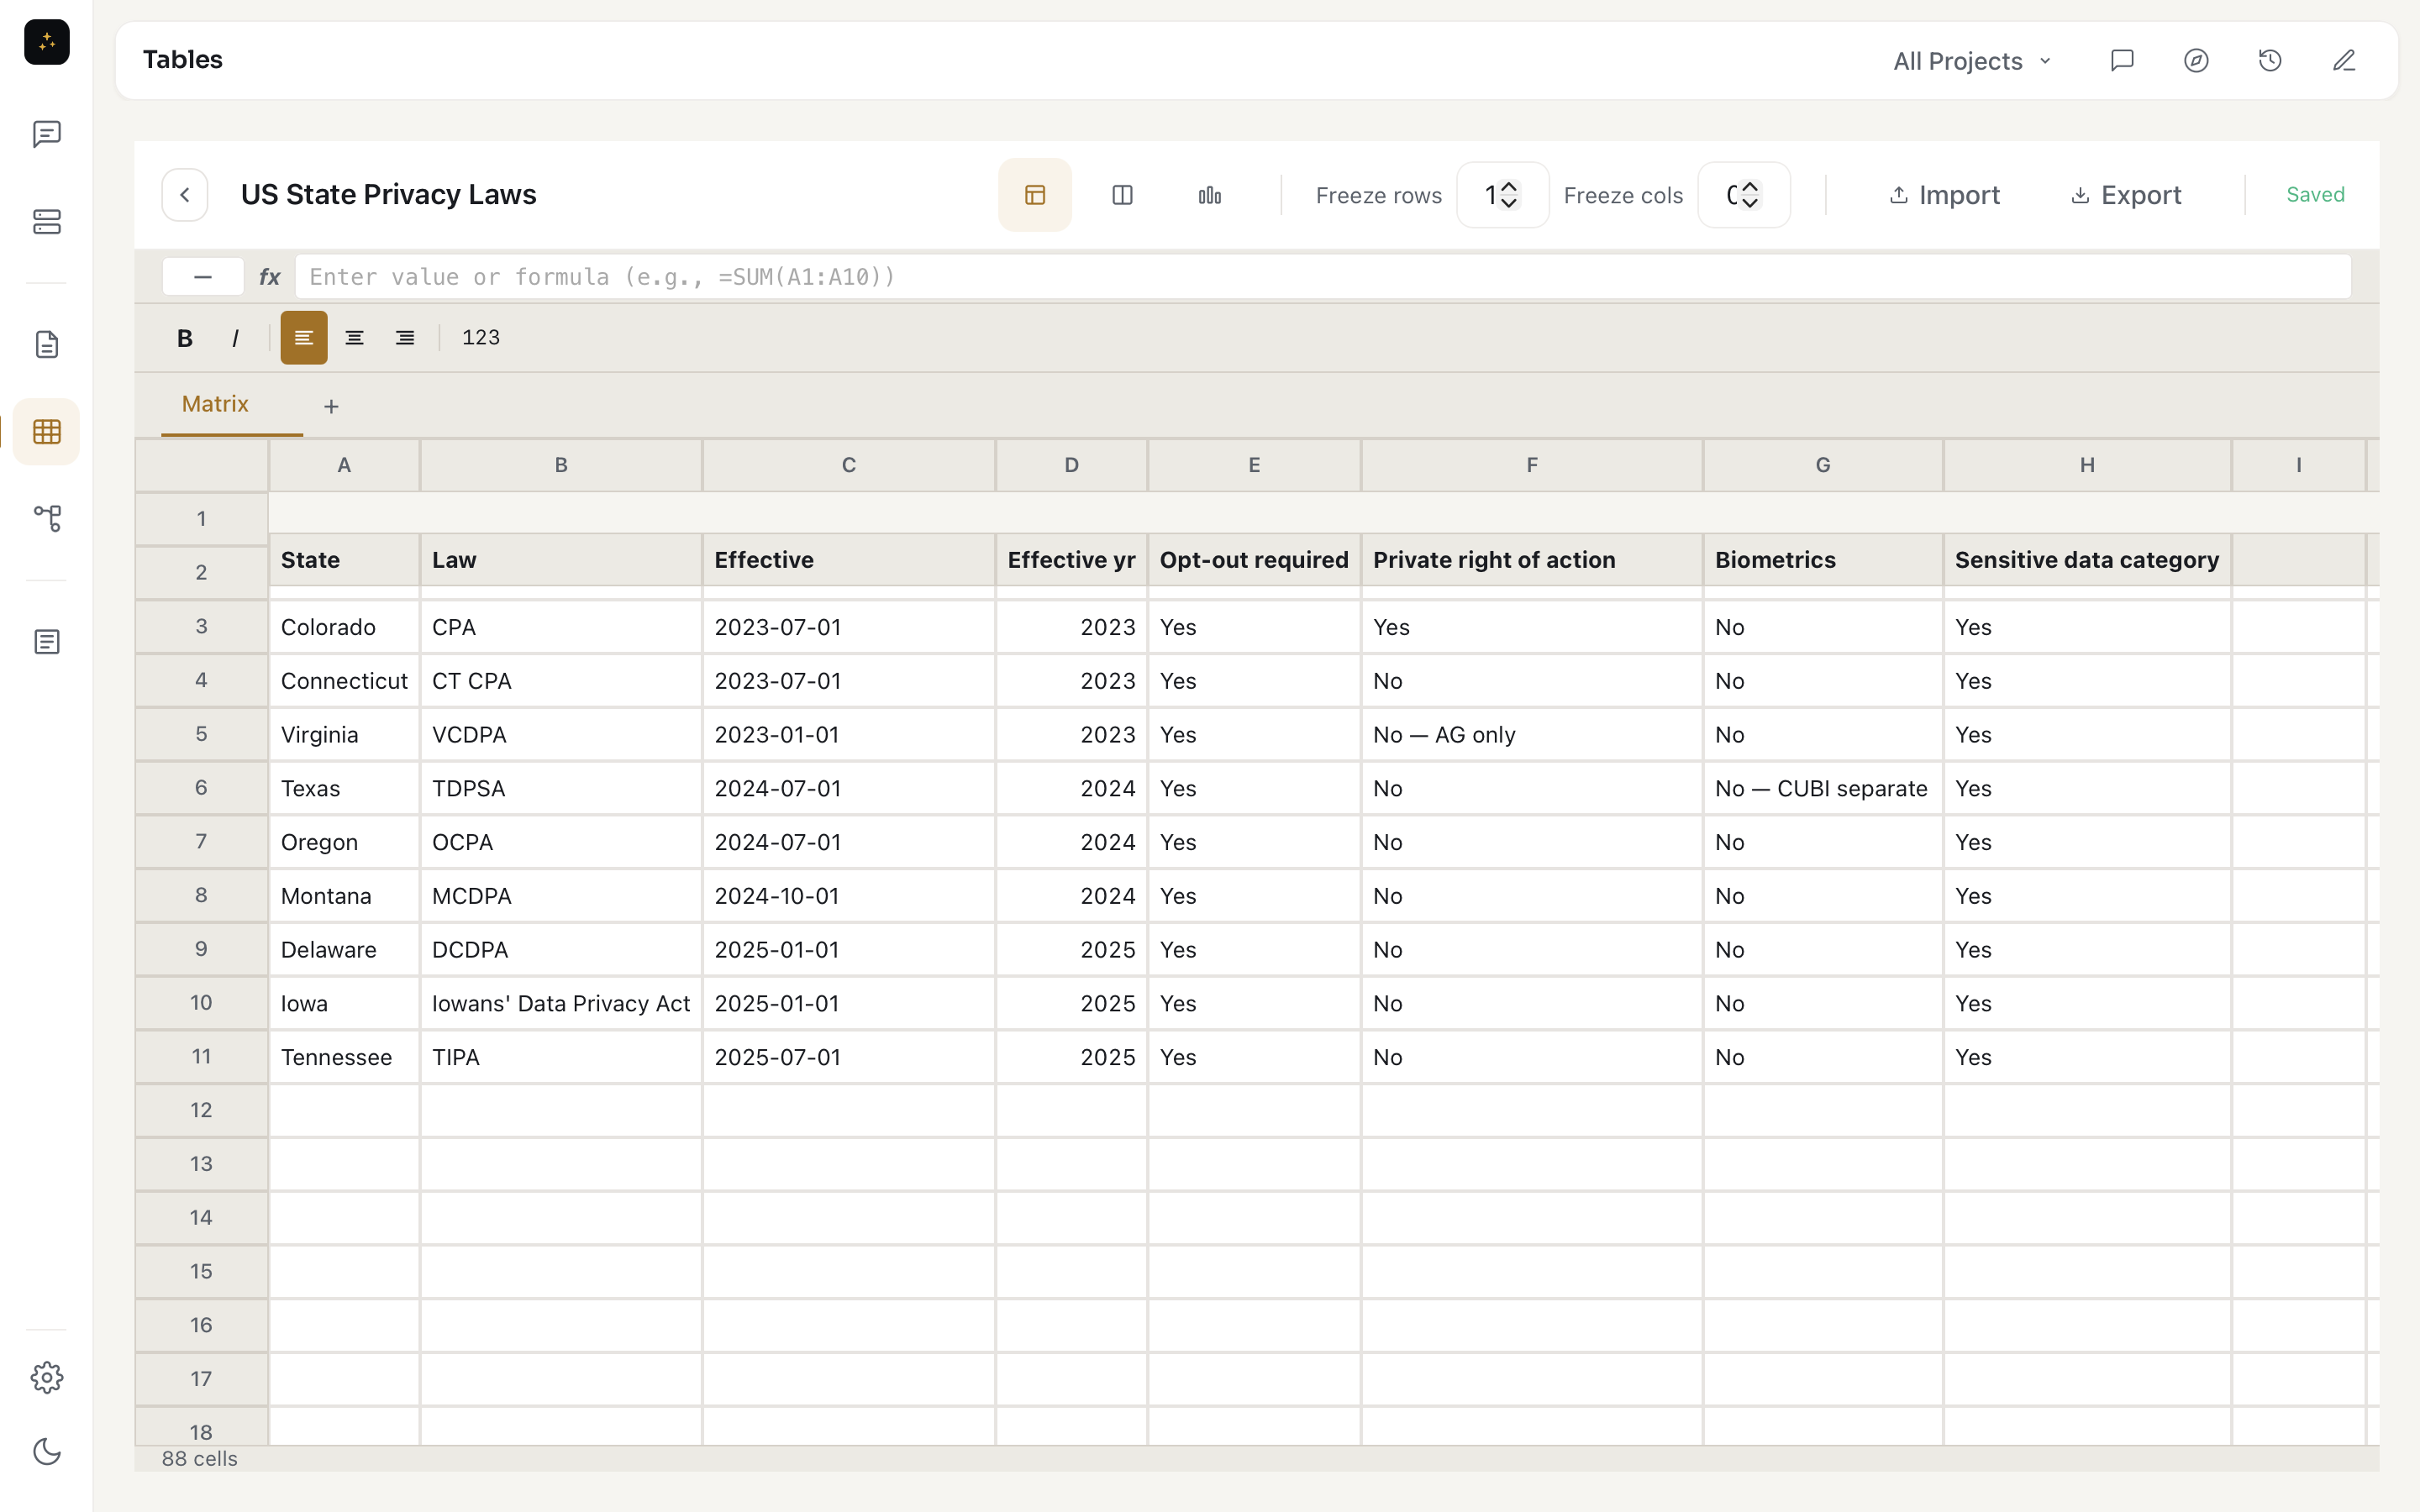
A full table editor with AI built in. Import your data, analyze it, visualize it, and export it — directly into your documents or as standalone files.
A table that understands what you're working on.
Not just rows and columns — a table connected to your project context. COTID™ knows your TID™ scope, so when you ask it to analyze data, it understands the domain, the terminology, and what matters in your field.
Import CSV, paste from Excel, or start from scratch. The AI handles formulas, pivot logic, and statistical analysis on your behalf.
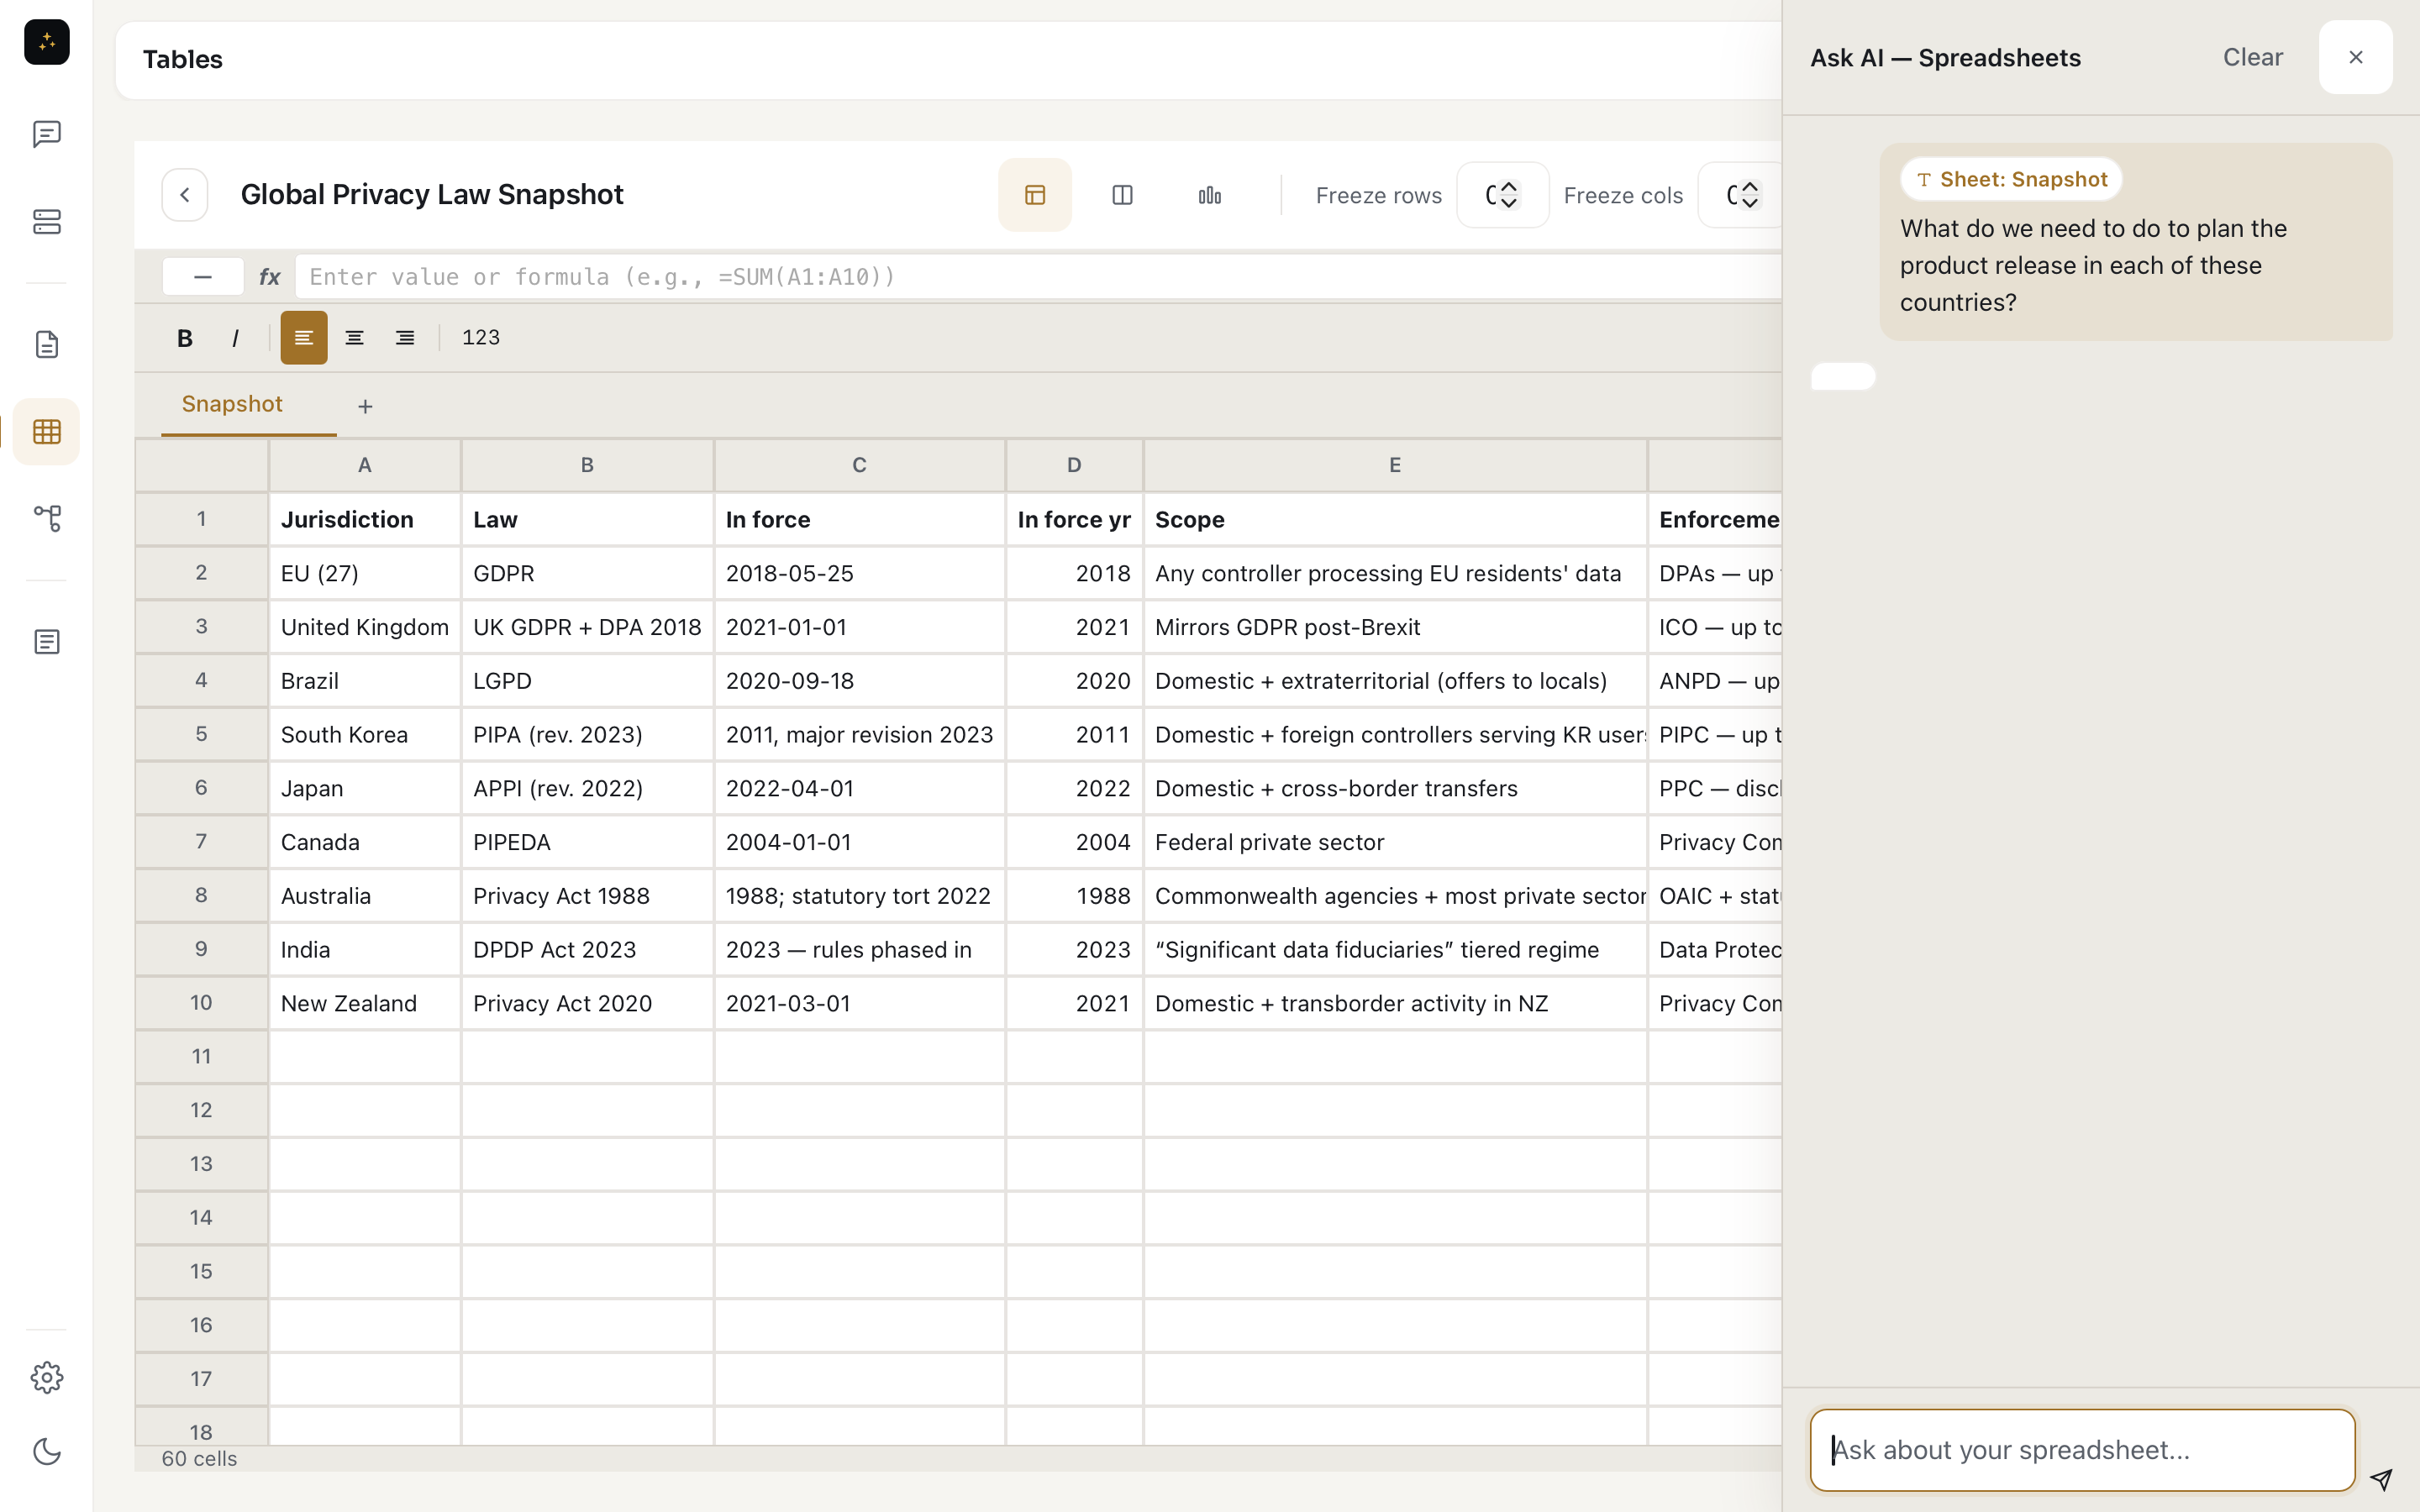
Ask questions about your data in plain language.
"What's the trend here?" "Show me the outliers." "Calculate year-over-year growth." Describe what you need and COTID runs the math — no formula syntax required.
Aggregations, comparisons, projections, statistical tests — all from a sentence. The AI shows its work so you can verify before using the results.
Turn data into charts instantly.
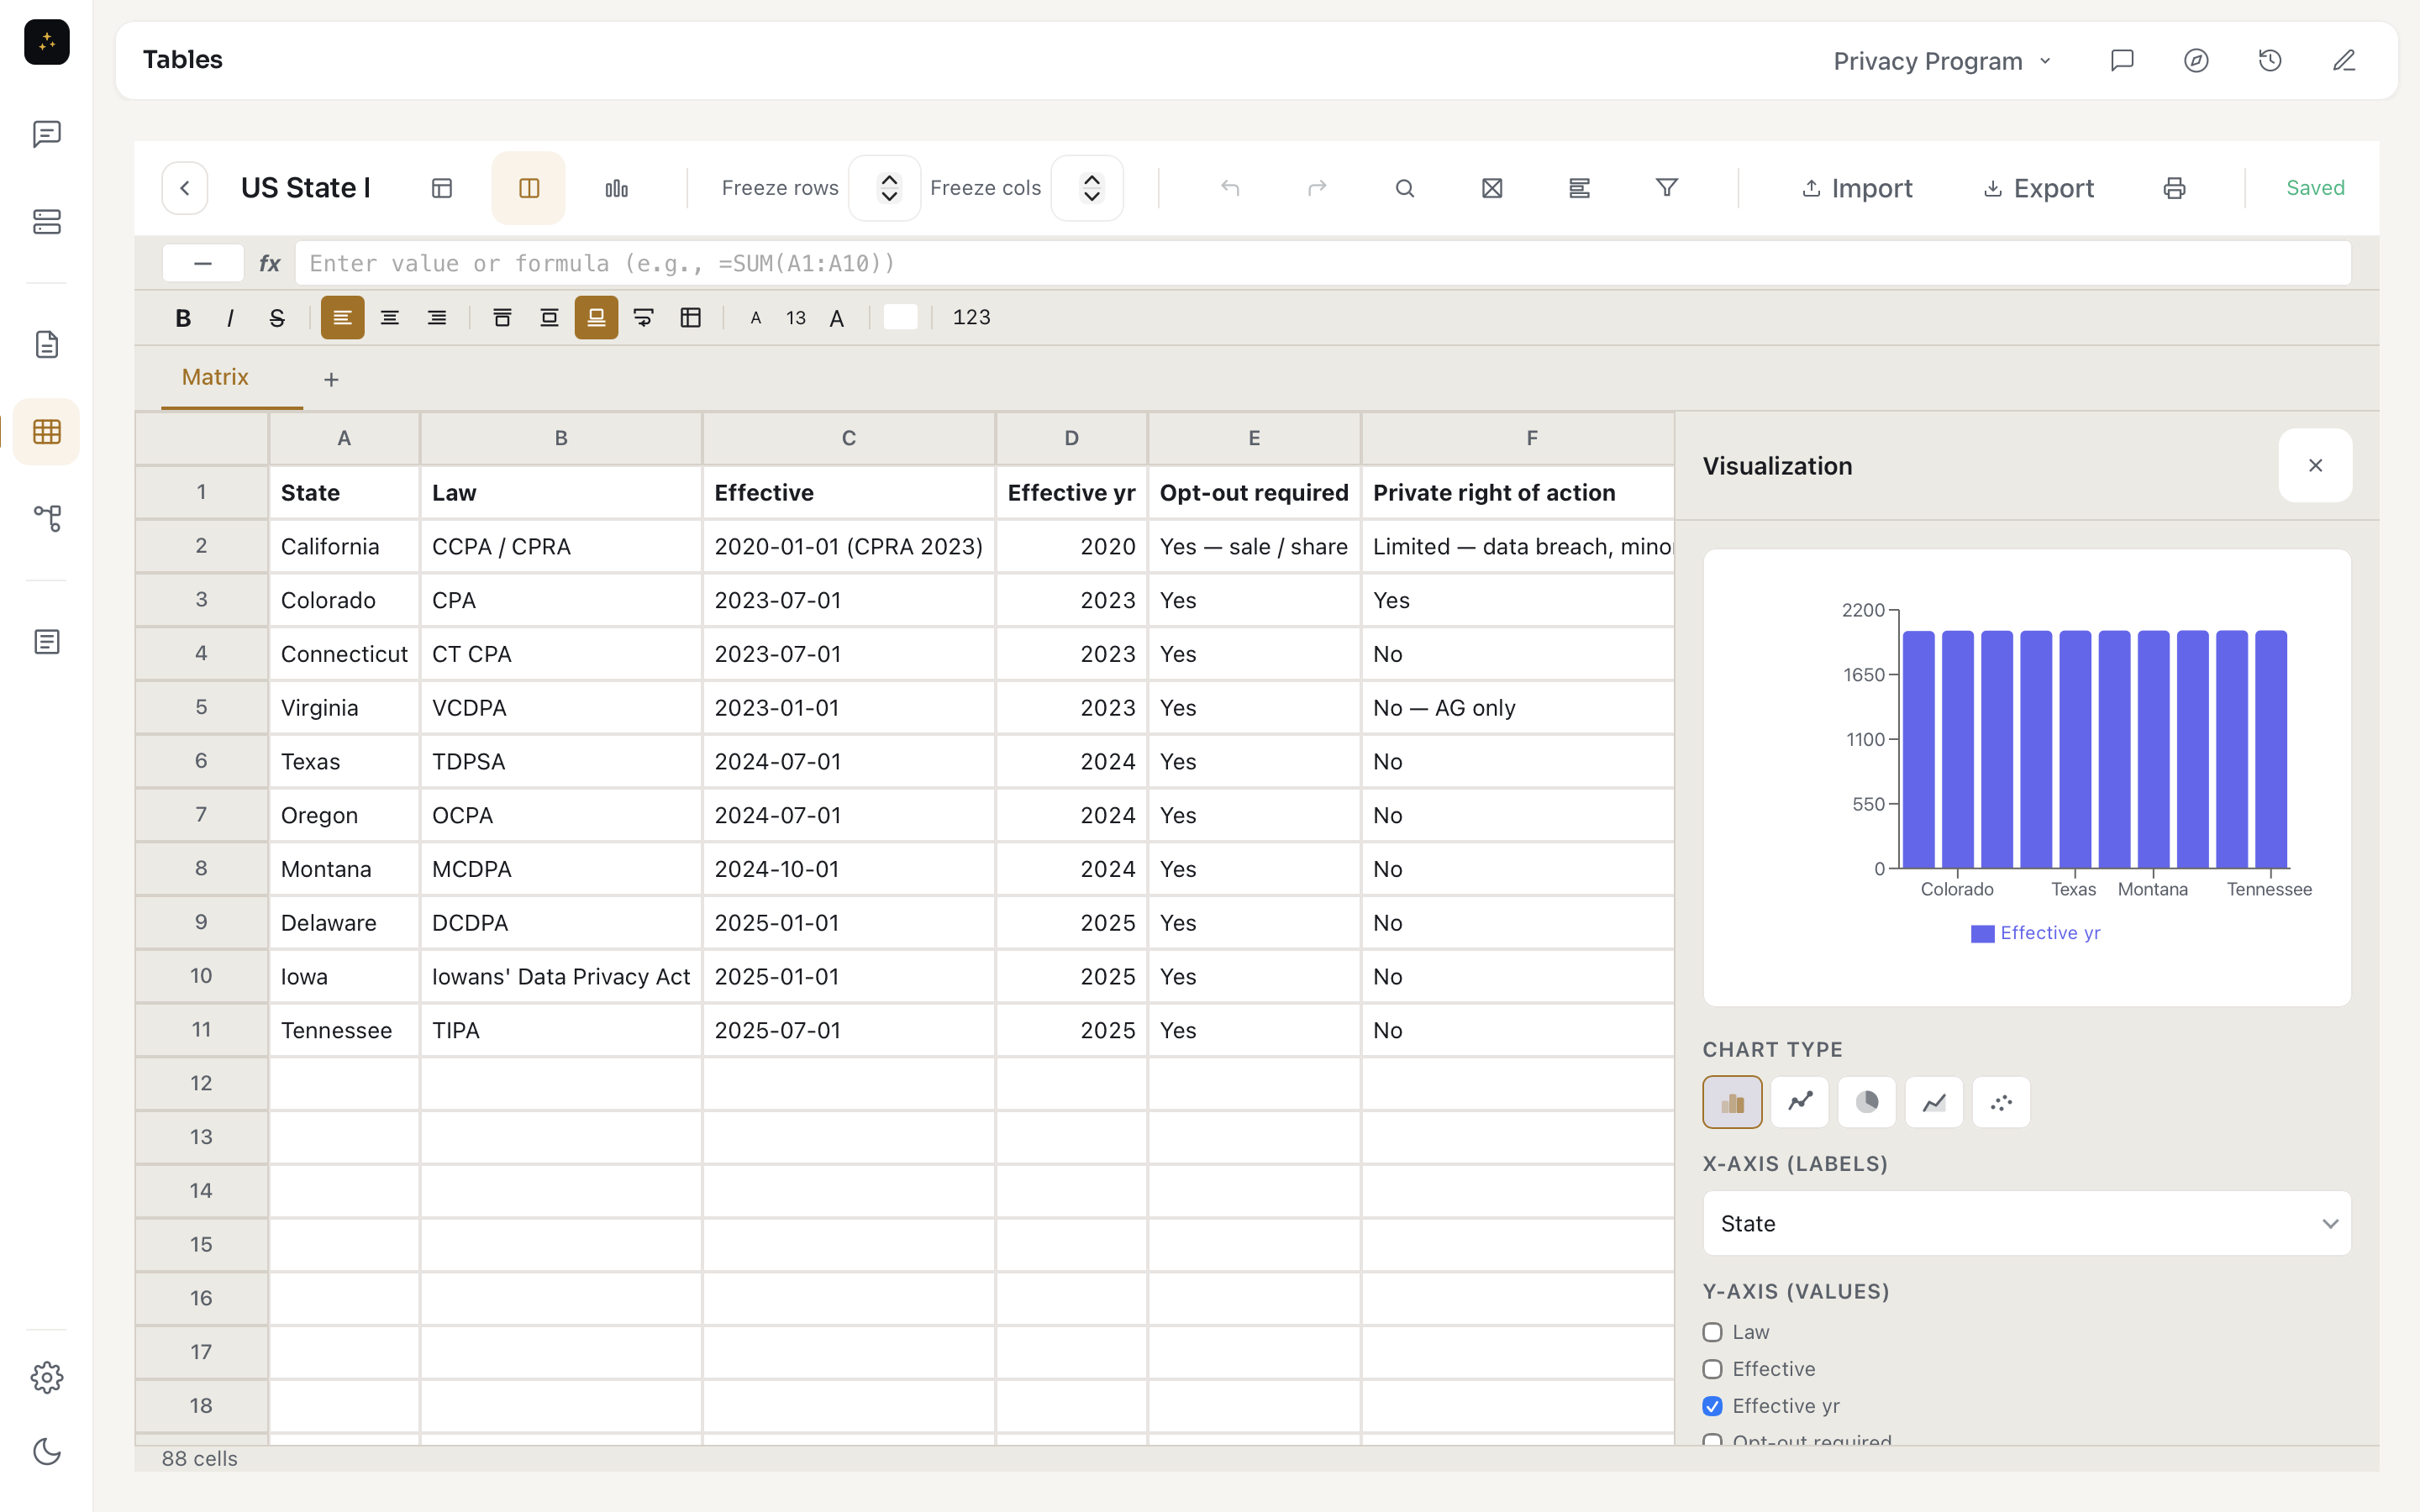
Select a range, describe what you want to see, and the AI generates the right visualization — bar charts, line graphs, scatter plots, pie charts, tables. Edit visually, adjust styling, export as PNG or SVG.
Data flows into your documents.
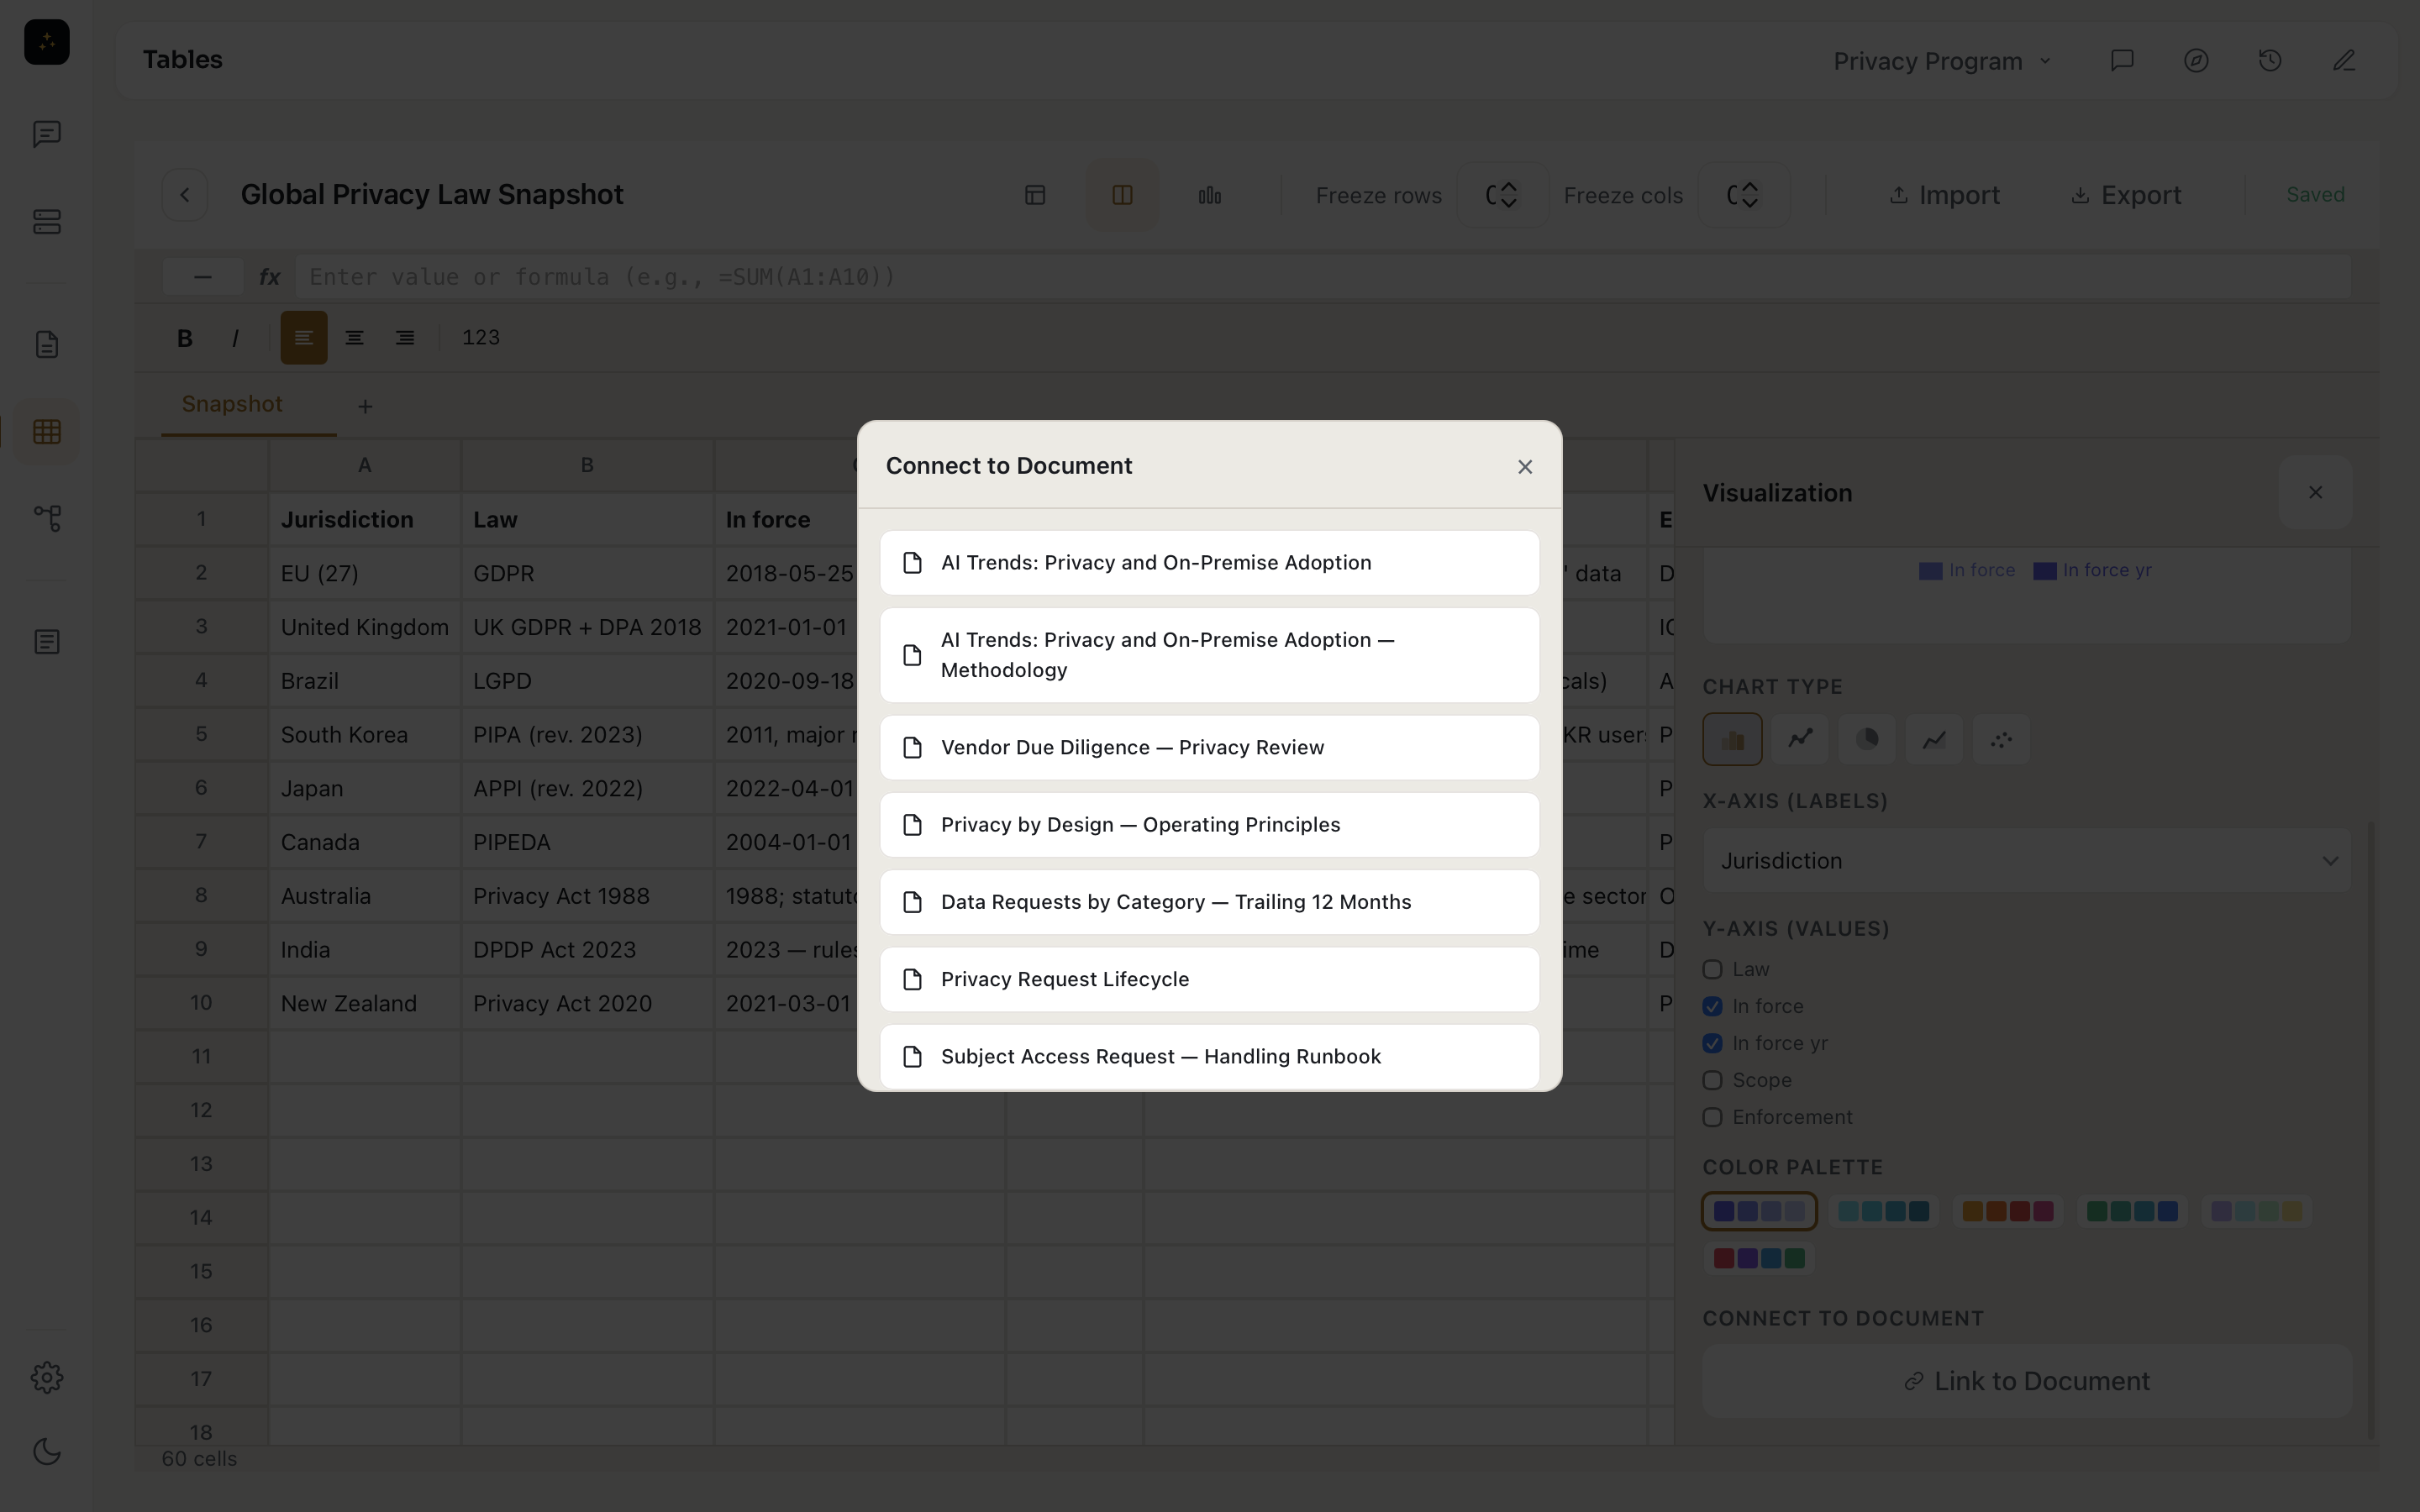
Charts and tables generated from your data connect directly to your documents. Update the data, and the visualizations update with it. No copy-pasting between apps. No broken links. One workspace.
Export as standalone files (CSV, PDF, PNG) or embed directly into any document in your project.
Everything stays local.
Your data never leaves your Mac. No cloud processing, no third-party analytics services, no uploads. Financial data, research datasets, client information — analyzed privately on your hardware.
- 100% local processing
- Works offline
- Zero tokens — analyze as much as you want
Your data. Your analysis. Your machine.
Free for 14 days. Every feature. Billed only after your trial.
Download Free Trial